Update: The code I had originally posted was hard to copy and not figuring the percentage accurately. This has been corrected.
This is a quick update to Claudio Cabaleyro’s ground breaking blog on endusersharepoint.com to use jquery and google charts api to create pie charts of SharePoint List data.
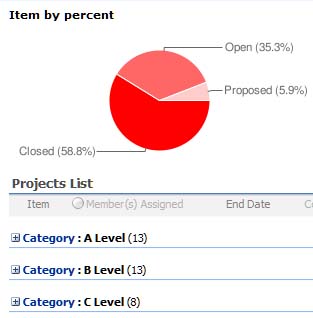
Here is Cabaleyro’s code slightly modified to show the percent instead of the count of items from the list. Hope this helps anyone who has been looking for this solution.
Copy and paste the following code
<script type="text/javascript">
if(typeof jQuery=="undefined"){
var jQPath="http://ajax.googleapis.com/ajax/libs/jquery/1.3.2/";
document.write("<script src='",jQPath,"jquery.js' type='text/javascript'><\/script>");
}
</script>
<div id="jLoadMe" class="content"><strong>Item by percent</strong></div>
<script type="text/javascript">
if(typeof jQuery=="undefined"){
var jQPath="http://ajax.googleapis.com/ajax/libs/jquery/1.3.2/";
document.write("<script src='",jQPath,"jquery.js' type='text/javascript'><\/script>");
}
</script>
<script
type="text/javascript">
$("document").ready(function(){
var arrayList=$("td.ms-gb:contains(':')");
var coord= new Array();
var labels= new Array();
var titles= new Array();
var total=0

$.each(arrayList, function(i,e)
{
var MyIf= $(e).text();
var txt= MyIf.substring(MyIf.indexOf('(')+1,MyIf.length-1); // Extract the ‘Y' coordinates
coord[i]=txt;
total=total+(txt*1)
var txt1= MyIf.substring(MyIf.indexOf(':')+2,MyIf.indexOf("(")-1); // Extract the labels
titles[i]=txt1;
//labels[i]=titles[i]+"("+coord[i]"; //update the total
//labels[i]=titles[i]+"("+Math.round((coord[i]/total*100)*10)/10+"%)"; //update the total
});

for(i=0;i<coord.length;i++)
{
coord[i]=Math.round((coord[i]/total*100)*10)/10
labels[i]=titles[i]+"("+coord[i]+"%)"; //update the total
}

var txt= coord.join(",");
var txt1= labels.join("|");

// Adjust Chart Properties below – See Google Charts API for reference
var vinc= "<IMG src='http://chart.apis.google.com/chart?cht=p&chs=300x120&chd=t:"+txt+"&chl="+txt1+"&chco=FF0000' />";
$("#jLoadMe").append("
"+vinc+"
")
});

</script>

Yep, nice one. People have been asking for that. — Mark
Byron,
I am glad you could add a variation to the code, something that, as Mark mentioned, was asked by other people.
Thanks and regards.
Claudio.
This is great… just what I was looking for to add to the charts I had created with the EUSP articles! I’ve already modified one of my charts this morning, and my sales people are really jazzed about it. Thank you!
(I was unable to copy the code, though… seems to be an image? But I was able to pick out the few lines that were the modification, and just typed them)
Sandy,
I had the same issue as you trying to copy the code in ie 7. In mozilla and chrome it was not an issue. Glad you liked it!
To get the code, hit the View Plain on the top menu bar and it puts in a notepad view for you.
Your site was extremely interesting, especially since I was searching for thoughts on this subject last Thursday.
hey can we make use of the 2 level of grouping possible in sharepoint lists, for maybe drawing a bar chart
Hmmm, the original version works fine. When I paste this version no chart shows. What am I doing wrong?
Make sure you have the right keyword (column you are grouping by) remember, capitalization matters!
Make sure that none of the line numbers were copied in.
If you are getting a javascript error (turn off friendly error messages) let me know and I will see if I can help you.
Bryon
Hi, I just have single list grouped, copied and pasted the code above in a CEWP, but no graph appears. I can copy and paste the code for totals and it works fine, but not percentage code. Can you offer any help? Thanks, CJ
I had the same issue. I mixed it with the original code. Try this:
if(typeof jQuery==”undefined”){
var jQPath=”http://ajax.googleapis.com/ajax/libs/jquery/1.3.2/”;
document.write(“”);
}
$(“document”).ready(function(){
var arrayList=$(“td.ms-gb:contains(‘:’)”);
var coord= new Array();
var labels= new Array();
var titles= new Array();
var total=0
$.each(arrayList, function(i,e)
{
var MyIf= $(e).text();
var txt= MyIf.substring(MyIf.indexOf(‘(‘)+1,MyIf.length-1); // Extract the ‘Y’ coordinates
coord[i]=txt;
total=total+(txt*1)
var txt1= MyIf.substring(MyIf.indexOf(‘:’)+2,MyIf.indexOf(“(“)-1); // Extract the labels
titles[i]=txt1;
//labels[i]=titles[i]+”(“+coord[i]”; //update the total
//labels[i]=titles[i]+”(“+Math.round((coord[i]/total*100)*10)/10+”%)”; //update the total
});
for(i=0;i<coord.length;i++)
{
coord[i]=Math.round((coord[i]/total*100)*10)/10
labels[i]=titles[i]+"("+coord[i]+"%)"; //update the total
}
var txt= coord.join(",");
var txt1= labels.join("|");
// Adjust Chart Properties below – See Google Charts API for reference
var vinc= "”;
$(“#jLoadMe”).append(“”+vinc+””)
});
I had a similar problem. I went through and reworked it using the most current code from Claudio and Byron (BIG THANKS TO YOU BOTH). Just be sure you are only capturing the code within the pre tags, I suggest using View Source.
The following code worked for me, I hope it helps!
Percentage View if(typeof jQuery=="undefined"){ var jQPath="http://dotnet/interfaces/content/"; document.write(""); } $("document").ready(function(){ var arrayList=$("td.ms-gb:contains(':')"); var coord= new Array(); var labels= new Array(); var titles= new Array(); var total=0 $.each(arrayList, function(i,e) { var MyIf= $(e).text(); var txt= MyIf.substring(MyIf.indexOf('(')+1,MyIf.length-1); // Extract the 'Y' coordinates coord[i]=txt; total=total+(txt*1); var txt1= MyIf.substring(MyIf.indexOf(':')+2,MyIf.indexOf("(")-1); // Extract the labels titles[i]=txt1; //labels[i]=txt1+"("+txt+")"; //add also coordinates for better read }); for(i=0;i<coord.length;i++) { coord[i]=Math.round((coord[i]/total*100)*10)/10 labels[i]=titles[i]+"("+coord[i]+"%)"; //update the total } var txt= coord.join(","); var txt1= labels.join("|"); // Adjust Chart Properties below - See Google Charts API for reference var vinc= ""; $("#jLoadMe").append(""+vinc+"") });I had a problem with your code – figured it out,
Here is the line of code that is messed up,
Line 46 after Append should look like this
(“”+vinc+””), and you will get the chart 🙂
I’ll try it like this instead:
//// Adjust Chart Properties below – See Google Charts API for reference
//var vinc=””;
//$(“#jLoadMe”).append(“”+vinc+””)
});
//
ok – nevermind – just look at Claudio’s code that matches line 46,47, 48 and 49 and copy it from there. I can’t get the code to display properly, and I know why 🙂
Hello,
I have the same problem as CJ. Can you please specify which is the jeyword that needs to be changed in the code?
Thanks a lot
Looks like the div tag got stripped. Let me try again 🙂
Percentage View
if(typeof jQuery=="undefined"){
var jQPath="http://dotnet/interfaces/content/";
document.write("");
}
$("document").ready(function(){
var arrayList=$("td.ms-gb:contains(':')");
var coord= new Array();
var labels= new Array();
var titles= new Array();
var total=0
$.each(arrayList, function(i,e)
{
var MyIf= $(e).text();
var txt= MyIf.substring(MyIf.indexOf('(')+1,MyIf.length-1); // Extract the 'Y' coordinates
coord[i]=txt;
total=total+(txt*1);
var txt1= MyIf.substring(MyIf.indexOf(':')+2,MyIf.indexOf("(")-1); // Extract the labels
titles[i]=txt1;
//labels[i]=txt1+"("+txt+")"; //add also coordinates for better read
});
for(i=0;i<coord.length;i++)
{
coord[i]=Math.round((coord[i]/total*100)*10)/10
labels[i]=titles[i]+"("+coord[i]+"%)"; //update the total
}
var txt= coord.join(",");
var txt1= labels.join("|");
// Adjust Chart Properties below - See Google Charts API for reference
var vinc= "";
$("#jLoadMe").append(""+vinc+"")
});
Please, can you help me for know what is the problem with my code.
I have a list with a grouping field “HorasxCategoria” with values:
+ Administrativas – [77] + {18}(1)
+ Asesoria – [25] + {3} (2)…
I like get values 77 and 18 for the first row and 25 and 3 for the second row.
I write the next code. please help me.
if(typeof jQuery==”undefined”){
var jQPath=”http://ajax.googleapis.com/ajax/libs/jquery/1.3.2/”;
document.write(“”);
}
$(“document”).ready(function(){
var arrayList=$(“td.ms-gb:contains(‘:’)”);
var horas= new Array();
var elementos= new Array();
var etiquetas= new Array();
var concatenado= new Array();
var leyenda= new Array();
var totalhoras=0;
var totalelementos=0;
$.each(arrayList, function(i,e)
{
var MyIf= $(e).text();
var nrohoras= MyIf.substring(MyIf.indexOf(‘[‘+
2),MyIf.length-15); //Extrae el total de horas de cada
//agrupamiento
horas[i]=nrohoras;
totalhoras=totalhoras+(nrohoras*1)
var nroelementos= MyIf.substring(MyIf.indexOf(‘{‘+
2),MyIf.length-6); /Extrae el total de elementos de cada
//agrupamiento
elementos[i]=nroelementos;
totalelementos=totalelementos+(nroelementos*1)
var etiqueta= MyIf.substring(MyIf.indexOf(‘:’)+2
,MyIf.indexOf(“-“)-2) //Extrae las etiquetas de cada
//agrupamiento
etiquetas[i]=etiqueta;
});
for(i=0;i<horas.length;i++)
{
horas[i]=Math.round((horas[i]/totalhoras*100)*10)/10
concatenado[i]="("+horas[i]+"%)";
leyenda[i]=etiquetas[i]+"("+horas[i]+"%)";
}
var txt= horas.join(",");
var txt1= concatenado.join("|");
var txt2= leyenda.join("|");
// Adjust Chart Properties below – See Google Charts API for reference
var vinc= "”;
$(“#jLoadMe”).append(“”+vinc+””)
});
I got this to work eventually, but only after prting the script in to dreamweaver to find it rejected line 46 as syntax error – I got it to work by joining 46&47 together thus:
$(“#jLoadMe”).append(“”+vinc+””)
the chart then loaded fine in sharepoint.
How do I get the count and percentage? Anyone?