Why can’t site owners add members to a SharePoint Group?

May 6, 2016

The other day I created about 20 SharePoint Groups for a page that that was to show a view customized to each department head.

Another Site Owner who had full control on the site, was to test it for me but found that he could not add himself into the groups that I had made for the audience mechanic.

The issue is this, ONLY the Group owner, which was me, can add members.  Site Collection Admins can of course, but site owners do NOT get rights to add members to any group by default.

The workaround is to make the owner of the group a SharePoint Group that includes all your site owners.


jQuery Announcement Rotator for SharePoint 2010

August 20, 2012

This code takes all your announcments on a site and rotates through them with a slick looking slider.  You can add images to your announcments, choose whether to display them or not, and add a link to a new article page if you wish.

This only works on SharePoint 2010!

1.Create an announcement list called “Announcements”.  On most team sites this exists already
2. Create a column called Image (Rich Text), PageURL (text) & Display (yes/no).  Capitalization Matters!
3. Upload text file with the below code and link to it with Content Editor webpart.  (Right click on the text file once it’s in Sharepoint library and click on “copy shortcut”.I

Notes:

If you already have announcements on the list, check the display property or they will NOT showup

For the Image, put an your image into the “Image” Rich Text box.  By default the SharePoint Logo will show up

The PageURL, paste the page you would like the Read More button to go to.


Special thanks to bxslider code at bxslider.com


<!--  Anouncment Rotator -->


<div id="slider"></div>

<script src="http://code.jquery.com/jquery-latest.js" type="text/javascript"></script>
<script src="http://bxslider.com/sites/default/files/jquery.bxSlider.min.js" type="text/javascript"></script>

<!--  Anouncment Rotator -->

<script type="text/javascript">


//--------------------------------------------------------------

var defaultImagePath="https://wyly.files.wordpress.com/2012/02/sharepoint1.png";
var nameOfList="Announcements";

//--------------------------------------------------------------

ExecuteOrDelayUntilScriptLoaded(GetAnnouncementInfo, "sp.js");


var myAnnouncements;

function GetAnnouncementInfo() 
{ 

  if($('#slider').length==0){return false;}  // If the div slider is not on page; Stop

  // Create query string using CAML syntax
  var myQueryString = '1'; 


  // Create client context 
  var myContext = new SP.ClientContext.get_current();
 
  // Get current web (comparable to SPWeb) 
  var myWeb = myContext.get_web(); 

  // Get list by title (comparable to SPList) 
  var myList = myWeb.get_lists().getByTitle(nameOfList); 

  // Create (empty) query (comparable to SPQuery) 
  var myQuery = new SP.CamlQuery(); 

  // Attach query string to query 
  myQuery.set_viewXml(myQueryString); 

  // Get items from list using query 
  myAnnouncements = myList.getItems(myQuery); 

  // Declare what to load (myAnnouncements with
  myContext.load(myAnnouncements,'Include(ID, Title, Body, Image, PageURL)');
 
  // executed async, we have to define what should  
  // happen afterwards (in case of success and in   
  // case of failure).  
  // We do this with the 'createDelegate': 
  myContext.executeQueryAsync(Function.createDelegate(this, GetAnnouncementInfoSuccess),Function.createDelegate(this, GetAnnouncementInfoFail)); 
 
  writeToAnnouncment(''); 
}

// This function will be called if the
// "executeQueryAsync" failed// (e.g. list not available, query string wrong or anything else) 
function GetAnnouncementInfoFail(sender, args) 
{ 
  // Show error message
  writeToAnnouncment('GetAnnouncementInfo() failed:' + args.get_message()); 
}

// This function will be called if the "executeQueryAsync"// succeeded 
function GetAnnouncementInfoSuccess(sender, args) 
{ 
  // Now we can use the data retrieved from SharePoint! 
  // Get number of items 
  var listReaderCount = myAnnouncements.get_count(); 

  // Show how much items have been found
  writeToAnnouncment(listReaderCount + ' Announcements where found');
 
  // Get the enumerator to be able to loop through the items

  var announcementEnumerator = myAnnouncements.getEnumerator(); 
  
  // Declare temporary variable for announcement details 
  var announcementDetails = '';

  // Loop through all items 

  while (announcementEnumerator.moveNext()) 
  { 
    // Get current item 
    var currentAnnouncement = announcementEnumerator.get_current();
    var readMoreLink=currentAnnouncement.get_item("PageURL");
    if(!readMoreLink){readMoreLink="../Lists/Announcements/DispForm.aspx?ID="+currentAnnouncement.get_item("ID");}
    var archivesLink='../Lists/Announcements/AllItems.aspx';
   	var image = currentAnnouncement.get_item("Image")
   	if (image==null){image="<img src='"+defaultImagePath+"' />"}

    // Concatenate values 
    announcementDetails +='<div class="artContainer"><div class="artImage">'
    						+ image
    						+ '</div><div class="artText"><div class="artTitle"> ' 
    						+ currentAnnouncement.get_item("Title")
    						+ '</div> <div class="artBody">' 
    						+ currentAnnouncement.get_item("Body")
    						+ '</div>'
    						+ '<a href="'
    						+ readMoreLink
    						+ '">'
    						+ '<div id="readmore-button">Read More&lt;!--<img src="" style="float:right;border:0;" />--&gt;</div>'	
    						+ '</a>'
    						+ '<a href="'
    						+ archivesLink
    						+ '">'
							+ '<div id="archive-button">Archive&lt;!--<img src="" style="float:right;border:0;" />--&gt;</div>'
							+ '</a>'
    						+ '</div></div>';
    			
  } 

	var startScroll=false;

  // Show the items and add then to the div
  
  //if no items show a message
  if (listReaderCount ==0){announcementDetails="No Anouncements for this Site";return false;}
  
  writeToAnnouncment(announcementDetails);
  
  if (listReaderCount &gt;1) {

	//Start the scrolling
	//$('#slider').bxSlider();
	$('#slider').bxSlider({    auto: true, pager: true, pause: 10000, prevText: '&lt;', nextText: '&gt;'  });
	
	}

	
} 


function writeToAnnouncment(msg)
{
	document.getElementById('slider').innerHTML=msg;
}


#readmore-button, #archive-button{

	margin-top:10px;
	margin-left:20px;
}


.artContainer{
	width:620px;
	height:300px;
}


.artImage{
	width:350px;
	height:300px;
	float:left;
}

.artText{
	width:250px;
	height:300px;
	margin-right:10px;
	float:left;
}

.artTitle{
	width:100%;
	min-height:30px;
	color:#002244;
	font-weight:bold;
	font-size:18px;
}

.artBody{
	width:100%;
	height:110px;
	overflow:hidden;
}

.bx-pager{
	position:relative;
	top:-20px;
	text-align:center;
}

.bx-pager .pager-active, .bx-pager a:hover {
    color: #DE312A;
    text-decoration: none;
}

.bx-pager a {
    color: #838383;
    font-size: 16px;
    padding: 0 10px;
}

.bx-prev, .bx-next{
	font-size:16px;
	font-weight:bold;
	color: #717073;
	position:relative;
	top:-40px;
	text-decoration:underline;
	display:none;

}

.bx-prev{
	left:20px;
	float:left;
	display:none;
}
.bx-next{
	left:-50px;
	float:right;
	display:none;
}


Setting Up A Complete Document Routing and Life Cycle Engine in SharePoint 2010

January 24, 2012

Recently for a client I was asked to map out a path in SharePoint 2010 for a complete document routing and lifecycle engine, using only out of the box functionality.  Below are the high level requirements

User Requirements:

  • Users are required to add metadata and taxonomy information whenever they upload a document
  • Users can “Publish” Documents from any site in the site-collection.
  • The documents should be routed by SharePoint to the proper destination based on metadata and taxonomy
  • Documents should “Expire” after a set period of time, an email should be sent to the user to keep, archive or delete the document

Architecture:

Components:

Custom Content Types:
All the above requirements depended on a set of custom content types.  The first content type was derived from the default document type and was called “Managed Documents”.  I used the Managed Documents to house my SharePoint Designer Workflows and my Information Management Policy.

Site Templates:
All libraries on the site that wished to use the document routing system needed to have a Content Type that derived from Managed Documents as the default content type. A site can be set up with the libraries set up this way and used as a template, for any additional sites created.


Document Center/Content Organizer:
The Content Organizer feature was used to handle incoming documents.  In Central Administration, in External Service Connections, Send To Connections are configured for each site where documents will be routed.  This allows SharePoint Designer workflows to use the action “Send to Repository”.  It also allows the Content Organizers to create rule to route documents to another Repository

Information Management Policy (for Content Type):
The Information Management Policy allows us to set a retention Policy on Managed Documents and its children content types.  After a set period of time, say 6 months, kick off SharePoint Designer Workflow.

SharePoint Designer Workflows:

  • Use globally-reusable workflow to move items to a repository (Publish)
  • Use globally-reusable workflow to be ran by the information management retention policy (Expiration)

How it works:

1 – Create a new Custom Content

  • Create a custom content type called “Managed Document” that derives from Document
  • Add a Boolean (Yes/No) column called Publish, set the default to No

2 – Set up Send To/Content Organizer

  • Turn on the Content Organizer Feature at the site level for at least one site
  • In Central Administration – Set up a Send to External Connection for the Content Organizer


3 – Create a SharePoint Designer Workflow

  • Create a reusable workflow called Publish and select Managed Documents as the Content Type
  • The workflow will check if the column Publish is checked.  If it is it will uncheck it then send the document to repository.  This means it will be sent to the site where you set up the Send To External Link in step 2.
  • Publish the workflow globally

4 – Attach the Publish workflow to the Managed Documents Content Type

  • Open up the Managed Documents Content Type and select workflows
  • Add the Publish Workflow to the list, give it a name and set it to fire manually, on creation and updates

5 – Go to a document library and make Managed Documents the default (or only) Content Type

  • Any Library with Managed Documents will now have the Publish workflow
  • The workflow will start automatically whenever a document is added or updated
  • If the publish column is checked, it will send the document to the Content Organizer you created

6 – Set up the Content Organizer Rules to route the documents

  • The Content Organizer bases it rules off the content type, then optionally, the columns in the content type
  • You can route the documents to a library/folder
  • If you have other Content Organized sites that have an external connection in Central Admin, you can have your content organizer Send the document to that site

7 – Set up Expiration Workflow

  • Create a reusable workflow called Expiration and select Managed Documents as the Content Type
  • Have the workflow email the user
  • The workflow then can either delete, archive or keep the document
  • Publish the workflow globally

8 – Attach the Expiration workflow to the Managed Documents Content Type

  • Open up the Managed Documents Content Type and select workflows
  • Add the Expiration Workflow to the list, give it a name and set it not to fire

9 – Set the Information Management Retention Policy to fire the Expiration work flow

  • Open up the Managed Documents Content Type and select Information Management Policy
  • Click on Retention – Add a new retention value
  • Set to Created 6 months, start the Expiration Workflow

Now, anywhere the Managed Documents Content Type is set on a library, The ability Publish the document and allow the Content Organizer rules choose what site, folder and library the document ends up in.  The Expiration workflow will kick off based on your retention Policy 6 months after the document is created, no matter where it resides and will appropriately, delete, move or keep it.

Considerations:

Documents routed by the Content Organizer will not start SharePoint Designer Workflows. This is one of the reasons we must rely on the Information Management Policy to start the expiration workflow

Default Content Types such as Document cannot have an Information Management Policy attached. Neither can the children of a custom content Type

Managed Metadata can be set up as columns either on the Managed Documents or its children

The document libraries with the Managed Documents content type, can be saved as templates, so can the entire team site with a Managed Documents library

The Documents, using the Send To External Links can be sent anywhere in the farm, including different site collection.  Keep in mind you must set the Custom Content Types on other site collections if you wish this to work throughout the farm.  You can use the manual send to link instead of the Publish work flow if you do this method.


Multiple Secure Pie Charts for SharePoint

June 10, 2010

Using the downloadable Yahoo javascript/flash library to create multiple secure pie charts for your sensitive SharePoint data

This is the second version of the code that I wrote. In this version, you can easily create two or more of the secure, yahoo pie charts on the same page inside SharePoint. Like the first version, this code does NOT require any outside api’s and will NOT send information over the internet like the google charts will.
If you do not need the security, I would highly recomend you use Google APIs instead since they are alot easier to work with when you make multiple pie charts.

Previous Posts I have done on Dynamic Pie Charts for SharePoint using Google’s APIs:

Summarizing Multiple List Content into a Single Pie Chart

Make a pie chart that shows percents

Adding Graphs, Bar and Pie Charts to SharePoint

Why YUI Charts are hard to Use:

The main is reason is sizing. The charts have a mind of their own on what size they will be. If you are going to use a single chart, it’s not that big of a deal, but if you have two charts, they will invariably be 2 different sizes when you get them up and running. They also can changes sizes if you later on add more items for the pie chart to group by. I will show you how to change the pie chart sizes in this tutorial, but it is mostly a trial and error process.

Requirements:

1. You must have permissions to add web parts to your SharePoint Site and know how to make a view of a list

2. You must know how to copy and paste 🙂

3. You must be able to download a zip file to your computer, unzip it and upload the javascript, css and swf(flash) files to a SharePoint Library

1. These Charts work on the basis of how you group your lists in SharePoint. In the following example, I made a list of projects and grouped it by ‘Status’ and ‘Category’. Notice that the ‘Status’ chart is hidden, that make it possible to chart a list without it actually being visible.

Edit view of the hidden list - grouped by 'Status'

2. Add a content editor web part and copy and past the below code into it.

You can download a text file of the code at http://americancapital.brinkster.net/spc/files/MultipleSharePointPieCharts.txt

* note: Currently wordpress.com is not letting me save the code. Please download the code from the above link


3. Set the keywords.
The keywords for the charts is at the very top in a div tag. look for:

<div id=”keyword_chart”>Status,Category</div>

and change ‘Status,Category’ to the names of you groupings on your SharePoint Lists (ie Product,Customer,Order). Remember that Capitalization does matter.

You may do the same with:

Where you want the legend to show up. Your options are Left,Right,Top or Bottom for each chart

Whether you want a total count of each item., percent or no numbers at all in the legend. Enter wither count, percent or none for each chart

If you have more than two charts:
Two or more charts requires some additional work. Find the following table in the code:


<!--Customize the number of charts here--></pre>
<table><!-- to make another row of charts, copy  the next 4 rows of code and paste it below the</tr>
 then rename id="chart1"  to id="chartX" X being count of charts you have-->
<tbody>
<tr>
<td class="tdchart"></td>
<!-- To make another chart, copy this whole row then change the id="chart1" to id="chart2"-->
<td class="tdchart"></td>
</tr>
</tbody>
</table>
<pre>

Notice that there are two examples right below in the code. One for three charts on one row, another for two charts per row on two rows. Use these as examples to display the charts the way you wish. Remember you MUST have a div (<div id=”chart1″ class=”chart1″></div>) INSIDE a td cell (<td class=”tdchart”><div id=”chart1″ class=”chart1″>) with a unique sequential (1,2,3,4…) id for EACH chart.

HTML for three charts on the same row:

</pre>
<table>
<tbody>
<tr>
<td class="tdchart"></td>
</tr>
</tbody>
</table>
<pre>

HTML for four Charts on 2 different rows

</pre>
<table>
<tbody>
<tr>
<td class="tdchart"></td>
</tr>
<tr>
<td class="tdchart"></td>
</tr>
</tbody>
</table>
<pre>

4. Resize the Pie Charts.

Almost without fail, you will need to individually edit the sizes of the Pie Charts. You do this by finding the chart sizes in the styles right above the display table (see html below). Edit the corresponding Chart’s height and width, it may take some time. Edit .tdchart if you want to edit the size of the container for all the charts.


<!--customize the size of the charts here add a new .chart1 - .chart2 - .chart3 and so on, for every chart you have. --></pre>
<style type="text/css"><!--
	.chart1	{float: left;width: 375px;height: 250px;}
	.chart2	{float: left;width: 450px;height: 300px;}
	.chart3	{float: left;width: 450px;height: 300px;}
	.chart4	{float: left;width: 450px;height: 300px;}
	.tdchart{width: 450px;height: 300px}
--></style>
<pre>

Secure Pie Charts for SharePoint

May 18, 2010

Using the downloadable Yahoo javascript/flash library to create secure pie charts for your sensitive SharePoint data

What chart looks like upon completion

I have done several blogs on how to use the google apis to create dynamic pie charts of lists in SharePoint based on code written by Claudio Cabaleyro and published at endusersharepoint.com. Perhaps the biggest request I have heard is, “How can I use these charts on my secure intranet?” Since Google Apps is an image that is shipped back to you after sending the required data and since SSL is not an option, Google Apps are useless for lists that use secure and sensitive data.

Previous Posts I have done on Dynamic Pie Charts for SharePoint:

Summarizing Multiple List Content into a Single Pie Chart
Make a pie chart that shows percents
Adding Graphs, Bar and Pie Charts to SharePoint

If you wish to put more than one pie chart on your sharepoint page, please go to this more recent post.

A recent comment on my blog suggested I look at the Yahoo User Interface or YUI as a possible solution. After a few hours work, I was able marry a YUI pie chart with the JQuerry SharePoint List parser and create a Pie Chart generated by your SharePoint List, that does NOT send you data outside the network.

Requirements:

1. You must have permissions to add web parts to your SharePoint Site and know how to make a view of a list

2. You must know how to copy and paste 🙂

3. You must be able to download a zip file to your computer, unzip it and upload the javascript, css and swf(flash) files to a SharePoint Library

1. This Chart works on the basis of how you group on your list in SharePoint. In the following example, I made a list of projects and grouped it by ‘Status’.  Notice that the chart is hidden,  that make it possible to chart a list without it actually being visible.

Edit view of the hidden list - grouped by 'Status'

2. Add a content editor web part and copy and past the below code into it. Set the chartkeyword in the code to the name of the column that you are grouping by.  You can download a text file of the code at http://www.sharepointcanvas.com/spc/files/SharePointPieChart.txt


3. Download the following zip file at http://www.sharepointcanvas.com/spc/files/piechartfiles.zip and unzip it then upload all the files to a SharePoint Library

4. Go to the files, right click and select ‘copy shortcut’ then paste this address over the link in the code going to Yahoo:

Getting the path of your SharePoint files

5. Paste the Shortcut over current link in the code

src=”http://yui.yahooapis.com/2.8.1/build/yahoo-dom-event/yahoo-dom-event.js

to

src=”http://yourpath/yahoo-dom-event.js

I would recommend that you first make sure the pie chart is working before switching out the file paths.  If something isn’t right the pie chart will just not show up.  As of this post, posting more than one of these on a page is not an option. I tried and the graphs seem to pick random sizes regardless of what you do to the width in the css.  I would recommend using the google charts if you don’t need the security since they are easier to work with.


Summerizing Multiple List Content into a Single Pie Chart

January 8, 2010

I was just asked by stump the panel on endusersharepoint.com if I could make the Pie Chart I demonstrated in a previous post, summarize content from multiple SharePoint lists. (see stump the panel thread –Summarizing List content in a chart…)

The scenario is once again you want to take a list and use google analytics to create a pretty pie chart.  But now instead of having one list you have two or more lists with the same groupings and then have the summarized data from all the lists in one pie chart.

Seemed easy enough so I gave it a swing and here it is.

As in the previous post, replace the keyword with the column on the lists you are grouping by.  Also you can hide the lists if you want only a pie chart dashboard.


<script type="text/javascript">
if(typeof jQuery=="undefined"){
var jQPath="http://ajax.googleapis.com/ajax/libs/jquery/1.3.2/";
document.write("<script src='",jQPath,"jquery.js' type='text/javascript'><\/script>");
}
</script>

<script type="text/javascript">
var chartkeyword = [];
var chartcolor = [];

////////////////////////// Customizations /////////////////////////////////

chartkeyword[1]="Release" 	//name of the first column that's grouped
chartkeyword[2]="Release"   //name of the second column that's grouped
chartcolor[1]="FF0000"		//Color of Pie Chart 1
chartcolor[2]="00FF00"		//Color of Pie Chart 1

var charts=2 // if you only want one pie chart chang this to 1

</script>
<table width=100%><tr>
<td><div id="jLoadMex1" class="content"><strong>

<!------------- Name of Chart 1 -------------------------->
Add a Name Here

</strong></div></td>
<td><div id="jLoadMex2" class="content"><strong>

<!------------- Name of Chart 2 -------------------------->
Add a Name Here

</strong></div></td>
</tr></table>

<script type="text/javascript">
$("document").ready(function(){

for(var i=1;i<=charts;i++)
{
makeChart(i)
}
});

function makeChart(i)
{
	var arrayList=$("td.ms-gb:contains('" + chartkeyword[i] + "')");
	var coord= new Array();
	var labels= new Array();

	$.each(arrayList, function(i,e)
	{
		var MyIf= $(e).text();
		var txt= MyIf.substring(MyIf.indexOf('(')+1,MyIf.length-1); // Extract the 'Y' coordinates
		coord[i]=txt;
		var txt1= MyIf.substring(MyIf.indexOf(':')+2,MyIf.indexOf("(")-1); // Extract the labels
		//labels[i]=txt1+"("+txt+")";   //add also coordinates for better read
		labels[i]=txt1
	});
	//----------Start of "Summerize Lists into a single Pie Chart" Code -----------
	var labelsCoords= new Array();
	for ( var count1=0;count1<labels.length;count1++) //Dupe Check
	{
		if (labels[count1]=="!delete!")
		{
			 labels.splice(count1,1); //delete dupe from array
			 coord.splice(count1,1); //delete numbers from array
			 count1-=count1; //reset the counter to match the index
		}
		else
		{
			for ( var count2 in labels )
			{
				if (labels[count1].replace(/ /g,"-")==labels[count2].replace(/ /g,"-")&&count1!=count2&&labels[count1]!="!delete!")
				{
					coord[count1]=(coord[count1]*1)+(coord[count2]*1) //total dupe counts
					labels[count2]="!delete!" //label as a dupe to delete
				}
			}
		}
		labelsCoords[count1]=labels[count1]+"("+coord[count1]+")";
	} 

	var txt= coord.join(",");
	var txt1= labelsCoords.join("|"); // This replaces  var txt1=labels.join("|");

	//----------End of "Summerize Lists into a single Pie Chart" Code -----------

	// Adjust Chart Properties below - See Google Charts API for reference
	var vinc= "<IMG src='http://chart.apis.google.com/chart?cht=p&chs=320x120&chd=t:"+txt+"&chl="+txt1+"&chco="+chartcolor[i]+"' />";
	$("#jLoadMex"+i).append("<p>"+vinc+"</p>")
}

</script>


6 Ways to easily “Juice” your SharePoint Pages

November 21, 2009

Right now I am in Birmingham Alabama getting ready to give a couple of presentaions at the SharePoint Saturday here.  I have uploaded the outline to how to Jazz up your sharepoint pages with no more skill than copy and pasting.

Three items are already covered in my blog; Pie charts, SharePointCanvas.com, and Hiding/Displaying web parts.  The other three are from other authors and I have provided links directly to their sites.  Please let me know if you are author on any of these sites and the links or credit due is not to your liking.

* note: I updated the Progress bar text to the code I use on my site, since the linked text did not work during the presentation.

Juice_your_SharePoint_page.doc

Here is the link to the outline for creating a Master Calendar or Library

Creating_ Master_Calendar_Presented.doc


Quickly Hide CSS on a SharePoint Page

September 10, 2009

ScreenShot of hiding SharePoint Items with a CSS Builder

Ever wish you could just make the top links disappear? Maybe kill the quick launch or the top navigation? How do you hide the global bread crumb, the site actions tab or the my links tag?

This site at http://sharepointcanvas.com allows you to uncheck all the elements you don’t want on your page then it will print out the css for you. Just copy and paste the css in a content editor web part or master page an viola! All you unchecked items are hidden from view.


Show/Hide Multiple Web Parts

May 22, 2009

Updated to work on SharePoint 2010

You have 4 web parts on the page but when the page loads you only see the first web part, ‘Overdue Tasks’. A dynamically created menu of all the task web parts is on the left.

When you click on ‘My Tasks’, ‘Overdue Tasks’ is hidden and ‘My Tasks’ appears in its place

Clicking on ‘All Tasks’ shows the All Tasks Web part

When you edit the page, you can see all 4 web parts and easily modify or reorder them.

Technical Expertise and Permissions needed:

  • Create views for a list
  • Add and Modify web parts on a page
  • Copy/paste some code into a content editor web part

Here I was again, trying to figure out how to show multiple views of the same list on my page. I had a task list and I wanted to show tasks for the current person (My Tasks), Overdue Tasks, High Priority Tasks and a Final view of all the tasks on the same page.

Problem is, there is a limited amount of real estate on the page to show all these views at once. I have in the past made multiple pages and placed one web part on each and made a menu that allowed me to go back and forth, the only problem is now I have to wait for a page load each time.

Fix:
I need some javascript or jquery to d hide all the webparts and only show me the one web part I want to see. My solution also has to do the following:

  • Be easy used by non-technical users
  • Work no matter how many web parts are included
  • Not hide the web parts in ‘edit page’ mode

Here is what I came up with:

I created views for Overdue Tasks, and High Priority in my task list. (All Tasks and My Tasks are created by default)

I created 4 web parts of the task list in one column on my page. I set there width to 600 px each gave each one a title with the word “Task” in it (my keyword). I set there chrome type to title only and I changed their view to one of the four views I wanted to show.

Next I added a content editor web part and added the following code:

<script type=text/javascript>
////////////////////////////////////////// User Chosen Parameters ///////////////////////////////////////////////
var displayFirst=false // Show the first web part on load
var menuTitle="" //Title of the top menu. If empty, spacing will be removed
var keyWord="Department" //The keyword in the title of all web parts used in this code. ie any web part with the word 'Tasks' will be hidden and added to the menu
var menuType="DropDown" //Enter 'List' or 'DropDown'
//--------------------------------------------------------------------------------------------------------------------------------------------------
</script>

<div class=content id=jLoadDiv></div>

<script type=text/javascript>
if(typeof jQuery=="undefined"){
var jQPath="http://ajax.googleapis.com/ajax/libs/jquery/1.3.2/";
document.write("<script src='",jQPath,"jquery.js' type='text/javascript'><\/script>");
}
</script>

<script type=text/javascript>
$("document").ready(function(){
 $("#jLoadDiv").html("");
if(menuTitle!="")
{$("#jLoadDiv").append("<p class='ms-WPHeader'><H3 class='ms-standardheader ms-WPTitle'>"+menuTitle+"</h3></p>")}
hideZones(1,displayFirst);
});

function show(item)
{
hideZones(0,false); //hide all web parts
var webPart
if(menuType=="List"){webPart=item.id}
else if(menuType=="DropDown"&&item!="none"){webPart=item}
else if(menuType=="DropDown"&&item=="none"){return false;}
document.getElementById(webPart).style.display=""; //Show selected web part
}

function hideZones(writeMenu,displayFirst)
{
var menu=""
var menuDD=""
if (displayFirst==false)
{menuDD="<option value='none'>--- Select an Item ---</option>"}
var listTitle = $("td:contains('"+keyWord+"')");//make an array of the titles of the web parts

$.each(listTitle, function(i,e)
{
var listZone=listTitle[i];
var wpnum
if (listTitle[i].title.length!=0){
//slice off the table title and select the web part number
wpnum="MSOZoneCell_WebPartWPQ"+listZone.id.substring(15);
//If not in edit mode, hide the web parts
if (displayFirst==false)
{
document.getElementById(wpnum).style.display="none";
}
else
{
displayFirst=false;
}
var Title=listZone.title.split(" - ")// get rid of the description by splitting on the " - " and only showing the first part
menu=menu+"<li><a href='javascript:show("+wpnum+");'>"+Title[0]+"</a></li>"
menuDD=menuDD+"<option value="+wpnum+">"+Title[0]+"</a></option>"
}
});
if (writeMenu==1&&menuType=="List")
{$("#jLoadDiv").append("<ul>"+menu+"</ul>")}
else if (writeMenu==1&&menuType=="DropDown")
{$("#jLoadDiv").append("<select onchange='javascript:show(this.value)' id='webShowHide'>"+menuDD+"</select>")}
} //end function
</script>

The code has three options:

var keyWord=”Tasks” – Put the keyword thats in all your web part titles here

var displayFirst=true – Leave this true if you want the first web part to show up on load

var menuTitle=”Whatever you want the title of your menu to be”

Viola!
Now the code will go out and add any web part that has your keyword in the title to a menu and then hide it. When you click on the menu item all the web parts will be hidden except for that web part (view).

UPDATE:
1 Fix has been added.
The webpart description has been filtered out so it won’t show up in the menu

There is a new menu type at the type, since several people asked for a drop down instead of a list for the menu.

At the top of the code, change:
var menuType=”List” – to show the menu as a list
var menuType=”DropDown” – to show a drop down list with all your selected web parts

Drop Down Menu


Why doesn’t my new column show up when I add or edit my list?

May 20, 2009

One of the first frustrations I had when learning SharePoint was wrapping my head around content types. A seemingly simple thing such as going to the MS Project Tracking template and adding a new column to the project list should mean that from now on, when I add or edit my list, I should see my newly created column just waiting to be filled, right? Wrong!

The reason is this; this template uses a Content Type for the project list and if you ever run into an issue where a column you created is not showing up on the add new or edit page or is not an option for a filter or content query part, the most likely reason is that you are working on a list that is using a content type but the option of “Allow management of content types” is set to “No”.

Fix:
Go to the list settings – under the heading “General Settings” select Advanced Settings.

Turning on Management of Content types

The first option is to “Allow management of content types”, set this to yes.

Now when you create a column, a new option will appear: Add to all content types. If this is checked, the column will now show up whenever you go to edit or a add a list item.

What if you have already added a bunch of columns? How can you now have them show up as options when adding and editing list items?

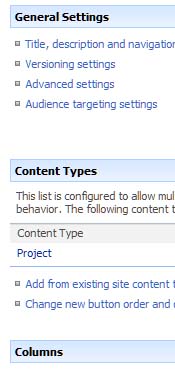
Now when you go to list settings you will notice a new heading above columns for Content Types.

Simply click on the name of the content type (in this case Project) and then on Add from existing site columns, this will allow you to add previously created columns to the lists Content Type.

Hope this helps anyone struggling with this issue. Just to know Content Types are very useful and there is a reason for not adding columns by default to your lists. Even though now it seems a bit awkward an unintuitive.